
Best Weather in the U.S. — Ranked by Forecast


Updated daily using consistent, data-driven weather criteria.

We rank the best weather across U.S. cities and national parks daily using the Perfect Weather Index (PWI), combining forecast temperature, wind, cloud cover, humidity, and precipitation into a simple 1–10 scale.


Scroll to see today’s map and ranks ↓


Today's Map

Saturday, May 2, 2026

Perfect Weather Map - Day 1

Find Cities That Match Your Personal Preferences

The rankings above reflect a broadly comfortable definition of perfect weather. If your ideal conditions differ — whether you prefer cooler temps, don't mind wind, or want to filter by chance of rain — try the custom weather tool.

→ Find Your Perfect Weather

Set your ideal temperature range, humidity tolerance, wind, and rain preferences — then see which U.S. cities best match your conditions today.


Perfect Weather Index (1–10)
Scores combine temperature comfort, sunshine, wind, and humidity into a single daily rating.

City names link to official National Weather Service point forecasts. Rankings are based on population-weighted averages and daily conditions. 


Best Cities Today

  1. Loading…

Worst Cities Today

  1. Loading…

Best States Today

  1. Loading…

Worst States Today

  1. Loading…

Why this map is different?

Most weather sites show forecasts. This shows comfort.
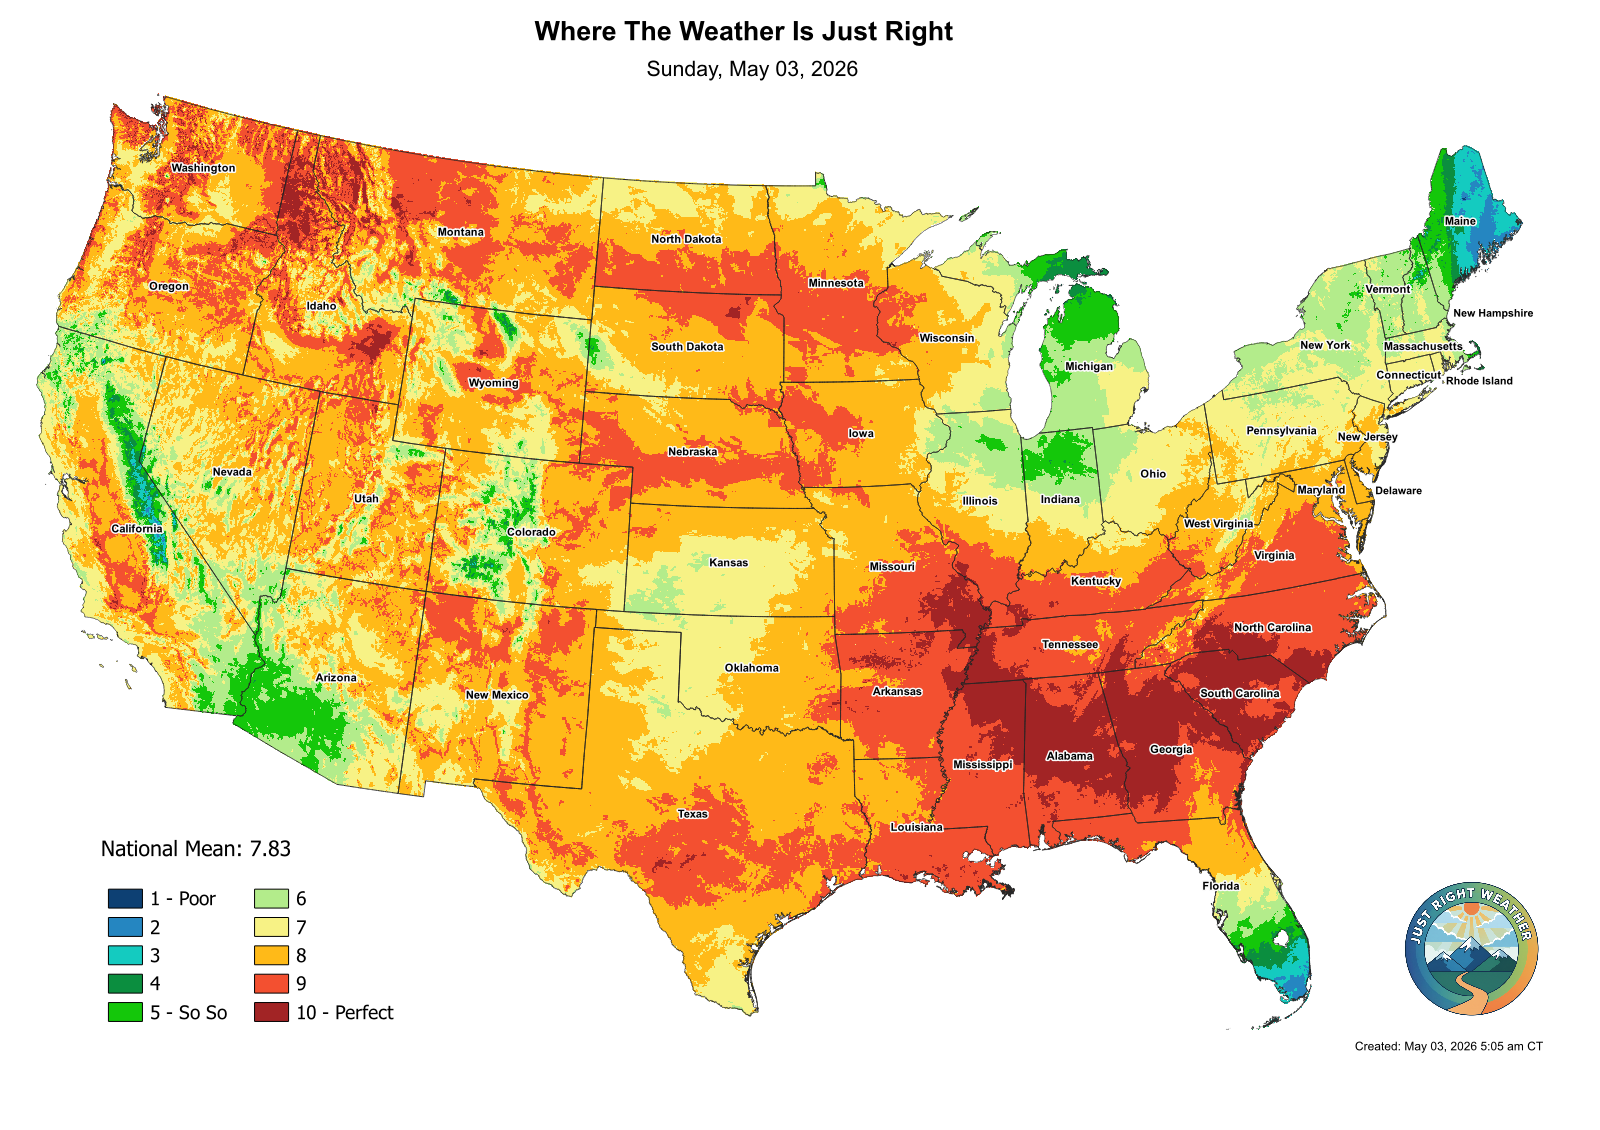
The Perfect Weather Index distills multiple weather variables into a single score so you can compare places instantly.


FAQ

Frequently Asked Questions

For this site, “perfect weather” generally means comfortable temperatures (around the low 70s °F), sunshine, light winds, and low-to-moderate humidity. The Perfect Weather Index summarizes those factors into a single 1–10 score to make it easy to compare locations.

Because weather affects mood and plans. I wanted a simple way to answer:
“Where in the U.S. will the weather feel best this week?”
and also explore longer-term patterns by month and year.

Cities: each city gets a raw score based on the forecast at its location. I also run a population-aware ranking so the “Top 10” isn’t dominated by tiny towns.

States: I calculate a statewide average (mean) score using the forecast grid over each state.

Yes. Forecasts and comfort can vary within a metro area (coast vs inland, elevation changes, microclimates). This index is best used as a high-level guide for comparing regions and finding candidates—then you can zoom in on local details.

That’s fair—weather preference is personal. This site reflects a broad, comfort-oriented definition that many people tend to describe as “nice weather.” Over time I may publish alternate rankings (for example: “cool & crisp,” “warm & dry,” or “best hiking weather”).

More questions?

If you have more questions, don't hesitate to ask!


Contact Us